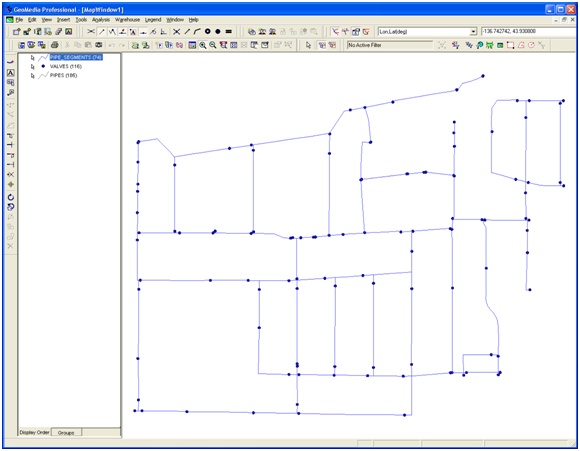
Fig 1 Layout of PIPES and VALVES at full extent
Fig 1 shows the PIPES and VALVES feature in full display. The lines represent PIPES and the dots represent VALVES.

Fig 2. A single pipe segment with associated valves
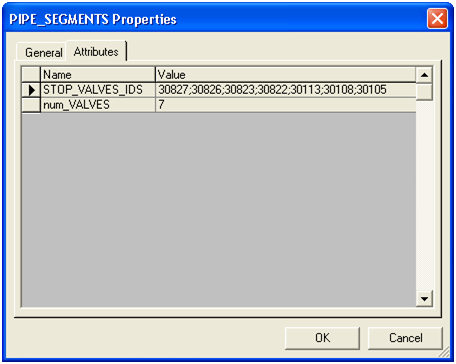
Fig 2-a. Details showing the number of valves and STOP_VALVES_IDS for the given segment.
On picking a fairly complicated section, we note that there are 10 valves, 7 of which are at the ends of the segment, and 3 of them lie on the segment linework. The detailed results show that in fact there are 7 valves, so it appears that either our methodology does not work, or that valves are not on the pipes as expected.
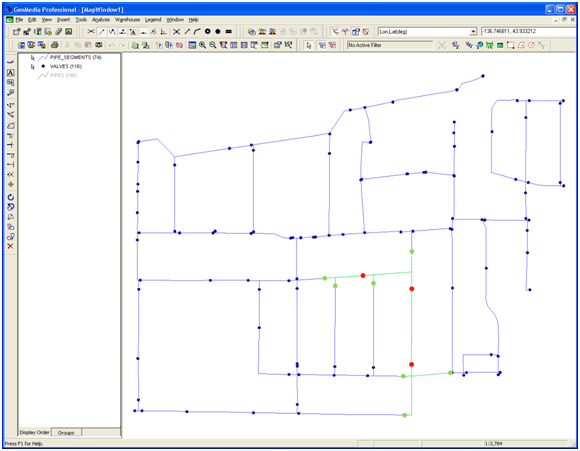
Fig 3.
Fig 3 shows the 3 interior Valves.
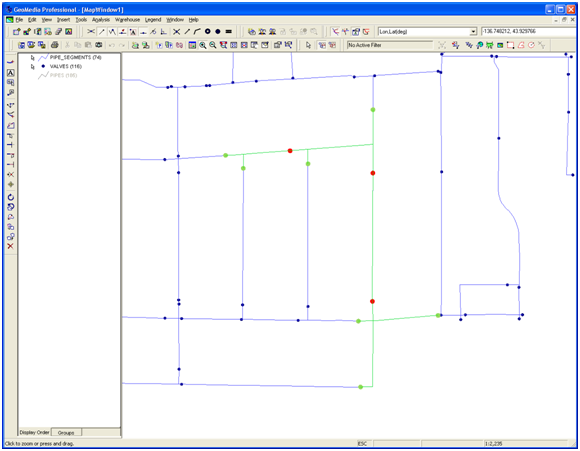
Fig 4
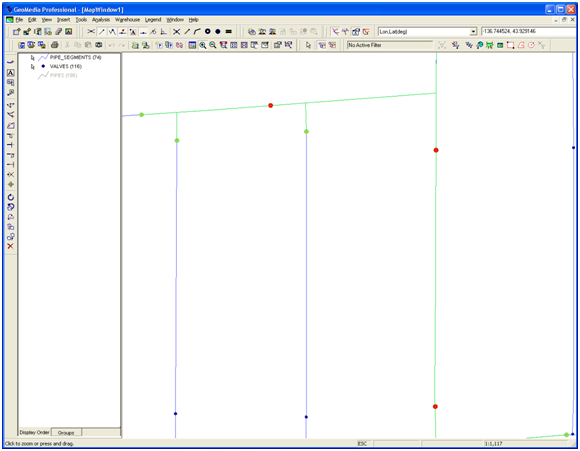
Fig 4-a
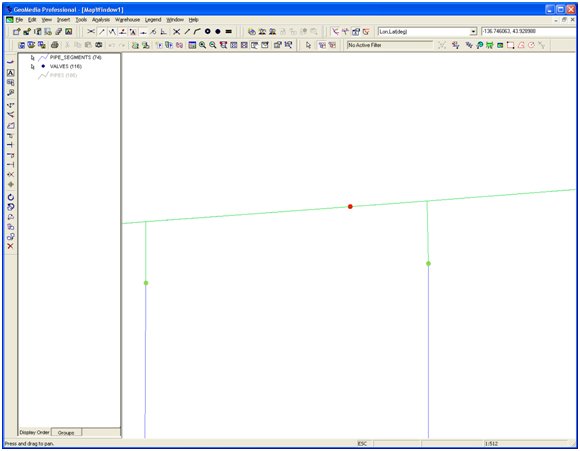
Fig 4-b
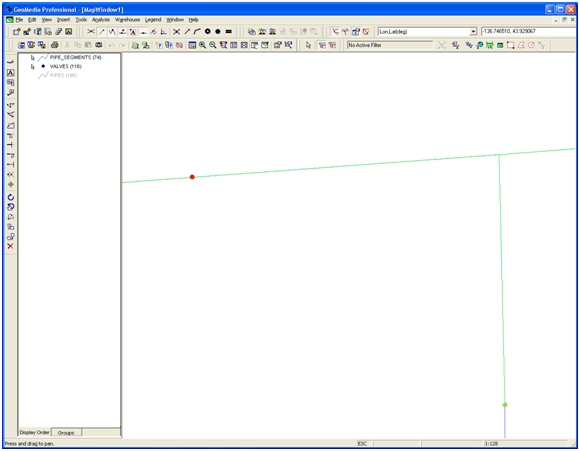
Fig 4-c

Fig 4-d
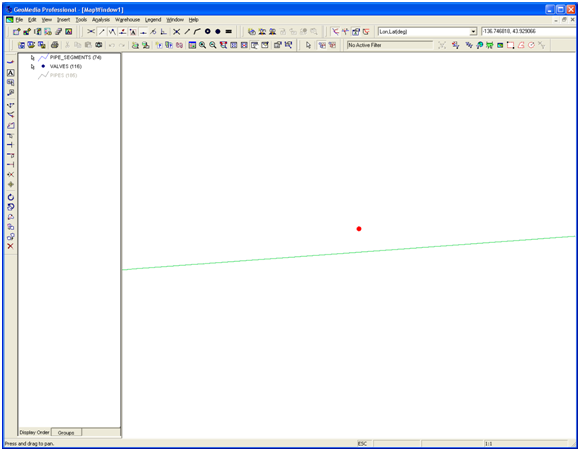
Fig 4-e
Fig 4, Fig 4-a through Fig 4-e show various zoom levels. It is not until Fig 4-e, where there is a 1 to 1 zoom level that we see that the valve is not located on the pipe.
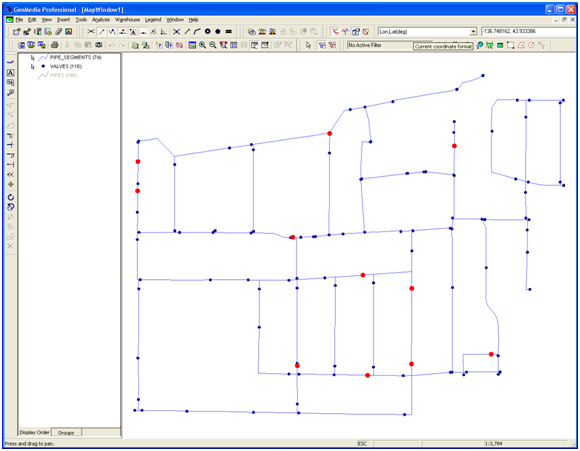
Fig 5
Fig 5 shows an analysis of all the valves that do not touch PIPES. There are 11 of them.
The recommended action is to investigate the existence of the valves, and if they in fact connect pipe segments, to correct the underlying GIS. Since the GIS linework is obtained from Engineering CAD drawings, corrections would have to be made there.
Authors Opinion:
This exercise demonstrates that merely converting paper drawings into digital form may not immediately create correct results. When a system is in a computer, there is expectation of a higher level of automation and correctness than paper documentation. As GIS analysts and professionals, we appreciate the limitations of the system and with an understanding of what is going on, can provide reasonable explanations for apparently unexpected results. Emergency maintenance personnel, working under the pressure of thousands of gallons of water leaking, under cover of darkness, and in flooded conditions cannot be expected to do the same deep level of analysis. It is possible that without proper training, and correcting the pipe network diagram, maintenance personnel would quickly lose faith in the digital maps since it does not appear to pick up valves on a pipe segment that exists on the ground. Since the purpose of the map is to identify shutoff valves in an emergency, relying on it in the current form may give incorrect results in the height of activity and confusion of a pipe break, where human reasoning may not be able to determine that it is the linework that is not fully correct.
No comments:
Post a Comment