Friday, October 24, 2008

Business Requirements - Parcel Definitions

The term parcel has different meanings to different departments for different purposes by different people, even though they may have a generally accepted definition.

  1. For eample, by looking at APN location on polygons, we see some adjacent polygons with the same APN. So does each polygon represent a parcel, or the adjacent polygons together constitute a parcel? A close examination shows that they are the same parcel with different lot numbers.

  2. There are disjoint polygons with the same APN. Does this mean that the set of such polygons constitute a single parcel, or is each polygon is parcel, in which case we either assume that a polygon does not necessarily have a unique APN, in which case it is a contradiction in terms.

  3. What about polygons that are not associated with APNs but are NULL instead? Should they be treated as a single or separate parcels?

  4. In a two storey building, there are 2 APNs associated with a given polygon. Here we have a polygon with two possible APNs - how do we distinguish one from the other?

Some reasons for these difficulties:
  1. Generally we like to have a single simple polygon represent a parcel with distinct APN. The majority of parcels appear to satisfy this criteria.
  2. When an APN consists of 2 disjoint polygons, it causes difficulty because to treat is as one feature requires that the feature cannot be simple, but is a compound feature which may cause difficulty in analysis.

The following is suggested as a more complete definition:

  1. We have a set of simple polygons that are the "footprints" made up of line features.
  2. Each simple polygons may be associated with 0 or more APNs.
  3. An APN is a number which may be associated with 0 or more polygons.
  4. Small polygons (small with respect to the scale of parcels are looking are) should be eliminated. The size depends on the accuracy and precision of the underlying data.
  5. The polygons for each APN are merged together into one feature. If the polygons touch one another, the result is a simple polygon. Otherwise the result is a compound feature.
  6. Polygons without APNs (i.e. those with Null APNs) should generally be merged together if they touch one another.

Let us consider what the definition of a parcel does for us:

  1. A parcel is a description of real property.
  2. Each parcel has a distinct legal owner or group of owners at any time.
  3. The components of each parcel are collectively considered a single unit of transaction.
  4. A legal owner or group of owners may own one or more parcels.
  5. An APN is a number provided by the County Assessor's office to uniquely define a parcel. Usually it is to identify a parcel on which to assess taxes.
  6. Some parcels do not have tax assessements. These may not have APNs, but there is still an owner, such as the city or the state.
  7. Some polygons, such as those bounded by right of way lines, may be considered parcels, but keeping track of them may not be the appropriate thing to do in the parcel layer.
Parcel Data - Slide 9

In the AutoCad layer show lines as boundaries, the Parcel Boundaries include the following types:
  1. Parcel Line (A line separating two land parcels)
  2. Private Right of Way Line (separating a land parcel from the Private Right of Way)
  3. Public Right of Way Line (separating a land parcel from Public Right of Way)
  4. Air Parcel Line (a line indicating a boundary between an "Air Parcel" and a land parcel or between two "Air Parcels")
  5. Parcel Split Lines (a Line that splits a parcel into two separate parts, each with a different APN but owned by the same owner, and where the parcels go together)

APN Locations include:

  1. APN Number
  2. Position of the APN, usually at or near the centroid of the bounding perimeter of the polygon

Wednesday, October 15, 2008

Application of Variable Buffer Radius

An example of how the Variable Buffer Radius feature in Geomedia can be applied to visualize data on a map. This was a poster presentation in the GeoSpatial World 2005 conference.


Additional descriptions will be added as time permits. Please add to comments section if you would like to see it sooner rather than later.

Cleaning up layers in a City BaseMap

The description is an expansion of a presentation given at the GeoSpatial 2005 conference held in San Francisco in April 2005. A slideshow of the presentation follows:


Additional descriptions will be added as time permits. Please add to comments section if you would like to see it sooner rather than later.

Thursday, September 25, 2008

Creating a Feature Class of Pairs of Intersecting streets .. Part 2 Limitations

The results are the points at which streets with different names connect to one another. In most cases, this satisfies the obvious meaning of the term cross street. But it could give rise to some strange special cases.

1) Does a T - junction constitute a cross street?
2) Does the point at which a minor street merges into a major street constitute a cross street?
3) Does a single street which changes names constitute a cross street? What if the difference is only the direction, but the name remains the same?
3a) Does a street that takes a sharp bend constitute a cross street?
4) Does a traffic circle with multiple spokes on it constitute a cross street? If so, is it the center point of the circle, or is each junction of the spoke intersecting the circumference of the circle a separate cross street? What is the name of the circumference street of the circle? If it does have a formal name, how do you distinguish the two points generated when a street enters and leaves the circle?
5) How do we handle loops when the street loops upon itself? The above procedure returns as a cross street the point where a street changes name with no other street crossing it. This requires us to have a more formal discussion of the term cross street.
6) How do we define the beginning or ending points of a street? One way is to call the beginning point as the point at which the street number is lowest, and the ending point at which the street number is highest. Another would be to avoid the problem completely by not distinguishing the ends (like a piece of rope that has two ends and no beginnings).
7) What if one road goes over another road (e.g. as at an overpass)? This could show up as a cross street, but would definitely would not meet the vernacular definition.

Monday, September 15, 2008

Creating a Feature Class of Pairs of Intersecting streets from a street centerline network

Step 1: We start with a set of features of Feature Class STREET_SEGMENTS (total 3793 features)

  • Each street segment consists of one continuous line feature and has the street segment name and a polarity (a way of showing that one end is the start and the other end the end of the line).
  • Different segments could have the same segment name
    * The segment name is actually the street name and has the following components
    a. Direction (N, S, W, E or Null)
    b. Street_Name
    c. Street_Type
  • Use Functional Attribute to generate a single string out of the three components. One such Functional Attribute would be to CONCATENATE the three fields together with a space and treated the Null direction as the empty string ‘’.

Step 2: Apply Analytic Merge to STREET_SEGMENTS to merge by attribute Segment Name to get STREETS. This will ensure that each Street Feature has a unique name (843 Features)

Step 3: Output Feature Class of the results of the STREETS query to a Geomedia Warehouse calling it MILPITAS_STREETS. While we could/should work with the query STREETS, at some point we will need to have an ID for referring to the streets, and writing out the Feature assigns an ID field.

Step 4: Apply Spatial Intersection of MILPITAS_STREETS that touch MILPITAS_STREETS to get intersections of all the Streets. (3565 features). The result will be a set of point and line features.

Step 5: Apply Attribute Query to the result from Step 4 with the Filter being ID – ID1 <> 0. This will remove features which consist of streets that are spatially equal to themselves. Details on why ID <>ID1 as a filter does not work is given in Identifying duplicate Spatial Features in GeoMedia (There are 2722 features which is 3565-843 as expected)

Step 5 is a query that produces a feature class where the every intersection appears at least twice, in different orders of the street names creating the intersection. In the case of junctions where 3 streets meet, there will be 6 features with the same intersection point, and in the case of 4 streets, there will be 12 features with the same intersection point. A illustrative example is the intersection of N and S Main Street and E and W Calaveras Blvd.

Discussion:

Step 5 produces a feature class that may then be modified for other purposes.

Suggested Modification 1: Eliminate duplicate combinations of cross streets so that each intersecting pair of streets appears once. One way of doing this may be to apply an Attribute Query to the Step 5 results with ID - ID1 > 0

Suggested Modification 2: By applying an Analytical Merge of the results of 5, and counting how many intersection point create each result, it may be possible to rename the results where the count is greater than 2. For instance, the case of N and S Main St intersecting E and W Calaveras Blvd may be considered Calaveras Blvd crossing Main St.

Application and Business Requirements:

The choice of modifications is in the realm of business requirements that determine how the data is to be used, and how cross streets should be defined. One application is to describe traffic accidents, and in that case if the order in which the street names are stated is not important, Modification 1 may be adequate for the purpose.

A second application is to create a street index of all streets cross each street. In this case, the data from Step 5 may be exported to an EXCEL spreadsheet and then manipulated.

Monday, September 8, 2008

Identifying duplicate Spatial Features in GeoMedia

Many times we have a feature class that has the same feature duplicated, and we want to identify which they are, so we can delete them.

Here is one method that works that has been applied in City of Milpitas GIS.

Let us have a feature class F which is a simple geometry class with an ID.

Step 1. Create a Spatial Intersection query between F and F (yes, with itself) for the geometries that are "Spatially equal"; We will call this Query 1

Step 2. Look at the results of Query 1 in a Data table. You will see ID and ID1 Columns. The number of entries in the table should be equal to or greater than the number of features in F

Step 3. Create an Attribute Query of Query 1 such that ID - ID1 < 0. We will call this Query 2. (This step is not obvious: What we want is ID < ID1, but GeoMedia does not accept that a valid expression, but ID-ID1 < 0 serves the same purpose.)

Step 4. Look at the result of Query 2 in a Data Table. If there are 0 entries, it means that there are no duplicate geometries in the Feature Class F. Each line in the Data Table of Query 2 shows a pair of features in F that are Spatially equal, where ID is the feature with the lower value ID, and ID1 is the feature with higher value ID.

Note that these are pairwise comparisons. So 2 features Spatially Equal show in 1 record, 3 features Spatially Equal will show 3 records, 4 features spatially equal will show 6 records, and so on.

The result is that we have now identified features that are Spatially Equal. The next step may be to keep one of the features, and delete the rest of the features that are spatially equal. This will be described in an upcoming post if there is enough interest.

Wednesday, September 3, 2008

Analysis of Results


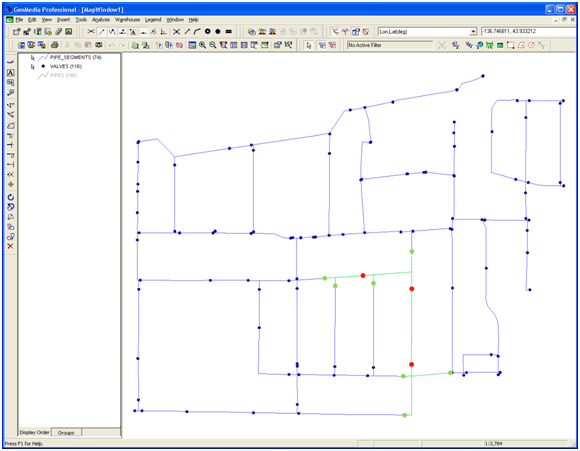
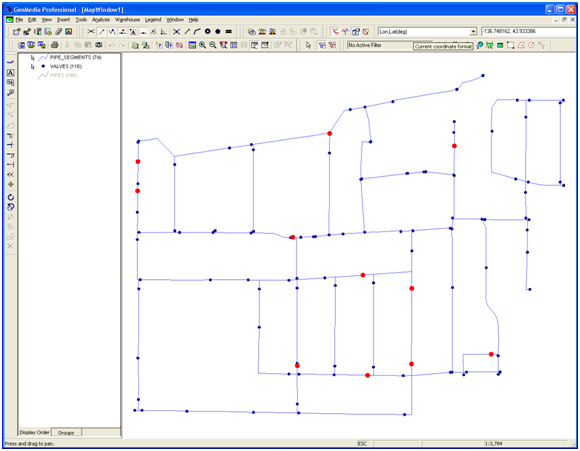
Fig 1 Layout of PIPES and VALVES at full extent

Fig 1 shows the PIPES and VALVES feature in full display. The lines represent PIPES and the dots represent VALVES.


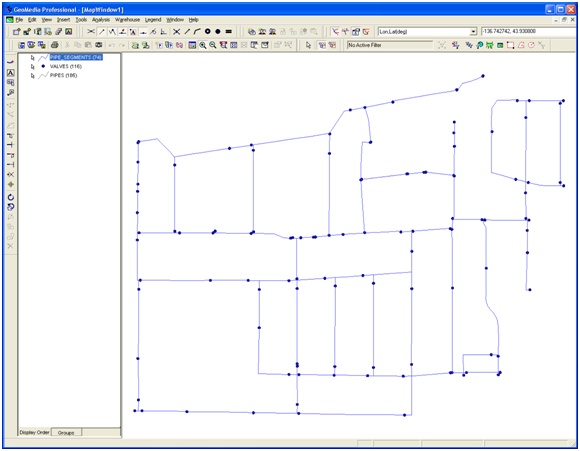
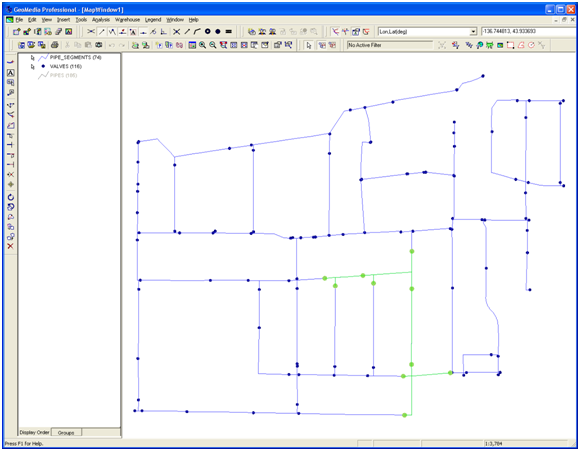
Fig 2. A single pipe segment with associated valves


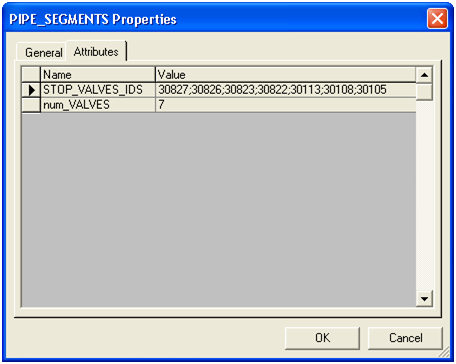
Fig 2-a. Details showing the number of valves and STOP_VALVES_IDS for the given segment.

On picking a fairly complicated section, we note that there are 10 valves, 7 of which are at the ends of the segment, and 3 of them lie on the segment linework. The detailed results show that in fact there are 7 valves, so it appears that either our methodology does not work, or that valves are not on the pipes as expected.


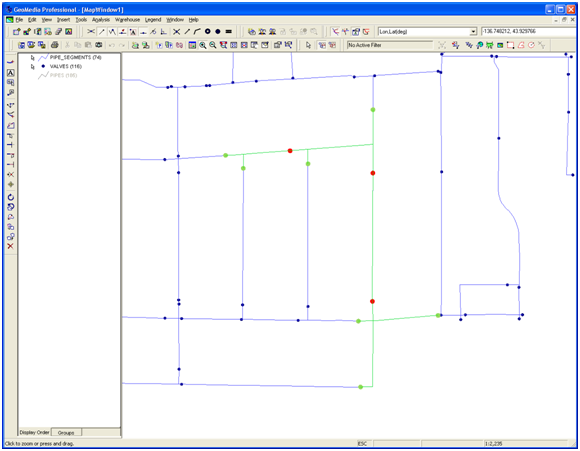
Fig 3.

Fig 3 shows the 3 interior Valves.


Fig 4


Fig 4-a


Fig 4-b


Fig 4-c


Fig 4-d


Fig 4-e

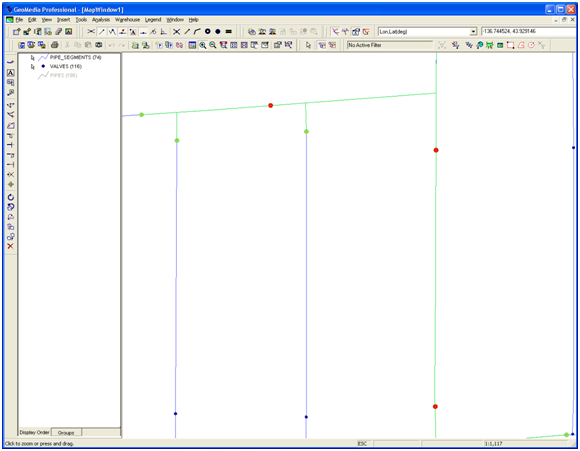
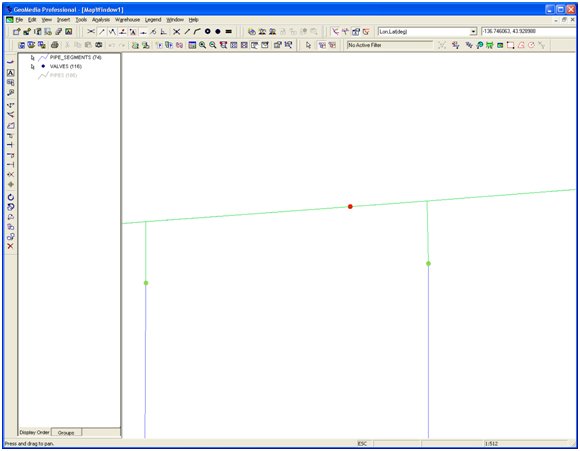
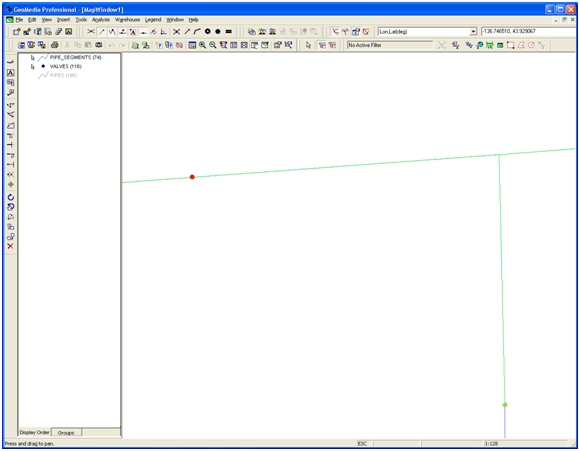
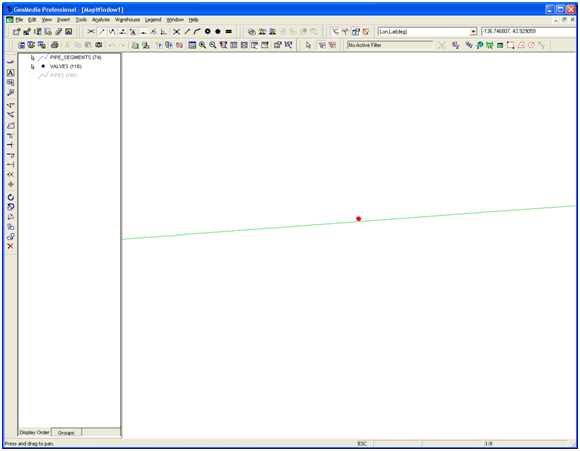
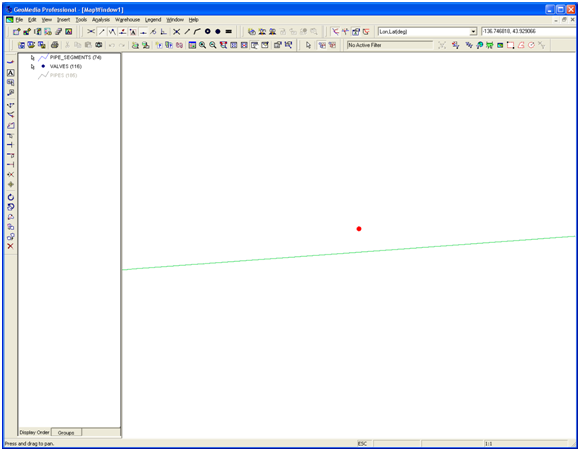
Fig 4, Fig 4-a through Fig 4-e show various zoom levels. It is not until Fig 4-e, where there is a 1 to 1 zoom level that we see that the valve is not located on the pipe.


Fig 5

Fig 5 shows an analysis of all the valves that do not touch PIPES. There are 11 of them.

The recommended action is to investigate the existence of the valves, and if they in fact connect pipe segments, to correct the underlying GIS. Since the GIS linework is obtained from Engineering CAD drawings, corrections would have to be made there.

Authors Opinion:

This exercise demonstrates that merely converting paper drawings into digital form may not immediately create correct results. When a system is in a computer, there is expectation of a higher level of automation and correctness than paper documentation. As GIS analysts and professionals, we appreciate the limitations of the system and with an understanding of what is going on, can provide reasonable explanations for apparently unexpected results. Emergency maintenance personnel, working under the pressure of thousands of gallons of water leaking, under cover of darkness, and in flooded conditions cannot be expected to do the same deep level of analysis. It is possible that without proper training, and correcting the pipe network diagram, maintenance personnel would quickly lose faith in the digital maps since it does not appear to pick up valves on a pipe segment that exists on the ground. Since the purpose of the map is to identify shutoff valves in an emergency, relying on it in the current form may give incorrect results in the height of activity and confusion of a pipe break, where human reasoning may not be able to determine that it is the linework that is not fully correct.

Friday, August 29, 2008

[Geomedia-l] Using GeoMedia to find shutoff valves for water mains‏

From: geomedia-l-bounces@directionsmedia.net on behalf of Alan Rich
Sent: Fri 8/29/08 11:49 AM
To: geomedia-l@lists.directionsmag.com

All,

A few weeks back, I asked if anyone had ever used GeoMedia to identify which shutoff valves should be turned off in the event of a water main break. My data consisted of water main line features and valve points snapped to the main lines.

Thank you very much to everyone that provided solutions to the problem.

That includes:
Bryan Clarke, Christchurch City Council, New Zealand
Jeff Hobbs, San Jose Water Company
Steve Hoffman, Intergraph Corp.
Pat Smith, Intergraph Corp.
Shahid Mujtaba, City of Milpitas GIS Volunteer


As it turned out, we ended up using parts of the various solutions in order to solve our problem. We had some data issues that kept us from using the provided solutions in their entirety. Shahid finally developed the workflow that we used. Here are the steps:

  1. Perform an Analytical Merge of the water main features using the “All” option.

  2. Create a small buffer zone (1 or 2 centimeters) around each valve

  3. Perform a Spatial Difference between the merged mains (output from 1.) subtracting the buffered valves (output from 2.)

  4. Take the output from 3. and apply Functional Attributes using the Geometries option.

  5. Take the output from 4. and apply an Analytical Merge using the Touching option.

  6. Take the output from 5. and perform an Aggregation using the output from 5. as the “Aggregate to summary features in”, and the buffered valves (output from 2.) as “From detail features in”, using “Touch” for the spatial aggregation. For the output, use the concatenate option specifying a comma for the separator and the valve id number to concatenate.

This will then allow the user to double click on a main which will expose the attribute window indicating which valve ids need to be turned off. The valve ids have previously been labeled on the map. This solution will allow us to use GeoMedia Viewer on field laptops to find which valves need to be turned off.

I plan to post this to both Shahid Mujtaba’s blog http://geomedia-analysis.blogspot.com and Jeff Hobb’s blog http://jeffhobbs.net.

Thanks again to everyone that offered advise. Your help made the difference!

Alan Rich
Geographic Information Systems (GIS) Manager
City of Milpitas
Milpitas, CA 95035


Saturday, August 23, 2008

Identifying StopValves that control a Pipe Segment

The Problem: Given a network of line and point features representing pipes and valves respectively, how to determine the stopvalves associated with a given pipe segment?

Business Purpose: If there is a break in a pipe, which valves must be shut off in order to isolate the break, and therefore prevent excess water loss.


Some definitions:
  1. A pipe section is a series of pipes joined end to end in a straight or continuous smooth line.
  2. Each pipe section has a unique PipeID associated with it.
  3. Each valve has a unique ValveId associated with it.
  4. Each valve should have 1 or 2 pipe sections attached to it.
  5. A valve controls amount of flow, not direction of flow: the direction of flow is determined by pressure values at different parts of the network. Consequently, water may flow in opposite directions through a valve, an in a pipe section at different times.
  6. A pipe segment is a set of pipe sections joined to one another so that the sections are topologically connected, and isolated from other pipe segments. It follows that each pipe section can belong to one and only one pipe segment.
  7. A pipe segment will have 2 or more ends to it. There are no pipe segments with 0 or 1 end (Actually a pipe segment with 0 end may exist if it is a ring or a closed polygon without any valves in it).
  8. Within a pipe section, individual pipes may meet end to end only. A T-junction would therefore be a place where 3 pipe sections join together in the pipe segment.
    A pipe junction could have more than 3 pipe sections coming together.
    A series of pipe sections may meet one another at angular junctions, so that any of the sections can be isolated by turning off 2 valves. These pipe sections make up a pipe segment.


The Problem described in abstract terms: For a given pipe segment, provide a list of ValveIDs at the ends of the segment.

Possible exception conditions:
A valve may not have any pipe segments associated with it. This would be a standalone valve which does not control any pipes.
A valve may show only one pipe segment associated with it. This means that the valve controls consumption of water flowing through it, or that the other segment possibly associated with it is not of current interest in the network.
The end of a pipe segment may not have a valve; this could mean that we are not interested in what happens at the end of that pipe segment.

One Solution algorithm in Geomedia:

Given: Line Feature PIPES and Point Feature VALVES
  1. Apply [ANALYTIC MERGE] to PIPES merging ALL geometries to create a feature query qry_merge_PIPES (Why? See Note 1)
  2. Apply [BUFFER ZONE] with small radius (1 mm or 1 cm) around VALVE to create feature query qry_VALVES_Buffered (Why? See Note 2)
  3. Apply [SPATIAL DIFFERENCE] with input qry_merge_PIPES subtracting qry_VALVES_Buffered to create a query qry_PSEGMENTS which is still a single feature consisting of joined and unjoined pipe (See Note 3)
  4. Add [FUNCTIONAL ATTRIBUTE] [Geometry] using the [GEOMETRIES] function to qry_PSEGMENTS.Difference_Geometry to create a query qry_PIPE_SECTIONS (See Note 4)
  5. Apply [ANALYTICAL MERGE] to qry_PIPE_SECTION by Merge Criteria [TOUCHING] to create a feature qry_PIPE_SEGMENTS. (See Note 5)
  6. Apply [AGGREGATION] with the summary feature in qry_PIPE_SEGMENTS from the detail features qry_VALVE_Buffered with spatiallty aggregation where the summary features [TOUCH] the detail features. Create an Output [FUNCTIONAL ATTRIBUTE] called [STOP_VALVES] which uses the function [CONCATENATE] function on the Detail.VALVE_IDs, separating them using a suitable separator such as a comma or a semi-colon. The resulting qry will be called PIPE_SEGMENTS. (See Note 6)
  7. Display PIPE_SEGMENTS. When the attributes of a particular PIPE_SEGMENT are displayed, the only attribute shown will be the list of STOPVALVES. (See Note 7)
Technical difficulties:

Note 1 This merges all the pipe segments together to get one or more unconnected pipe networks.
Note 2 This makes the valves to small circular areas and why we do so will become clearer at the end of the next step.
Note 3 In theory it should be possible to subtract the VALVES directly from PIPE_NETWORK so that there is a break where the valve is located. In practice, GeoMedia will not allow [SPATIAL DIFFERENCE] between line and points, only between lines and lines or lines and areas.
Note 4 What we want here is to separate each pipe segment. However, Geomedia will do this, and in addition, will also break apart pipe segments where pipe sections meet at an angle, and at T-junctions.
Note 5 By comparing the number of pipe segments together with the original pipe segments, we can get an idea of any inconsistent network.
Note 6 This is a means of associating the valve buffers with the pipe segments they each helped to create. The CONCATENATE function works because the VALVE_IDs were text rather than Numbers.
Note 7 To generate Valve Segment IDs, we need to output the query to a feature.


Data Quality issues:

  1. 1 valve with no ID
  2. some valves do not touch pipes - suggests (a) valve does not exist in reality (b) linework error 3) some pipe sections appear in multiple segments - this means that some of the original pipe linework had valves sitting on a continuous pipe.
    Since original data came from CAD system, it is necessary to correct the data at the CAD level, rather than update at the Geomedia level.